
Role
Own designing from concept to high fidelity, writing design requirement documents, kick off process, developing research plan, ux recruitment, 5 rounds of research sessions from concept validation, surveys to usability testing, QA, and launch.
Team
Viet - Principal PMVaibhav - Tech lead - Back end engineerDenzel - Senior Back-end engineerCourtney - Senior Front-end engineerKatie - Senior Front-end engineer
Background Context
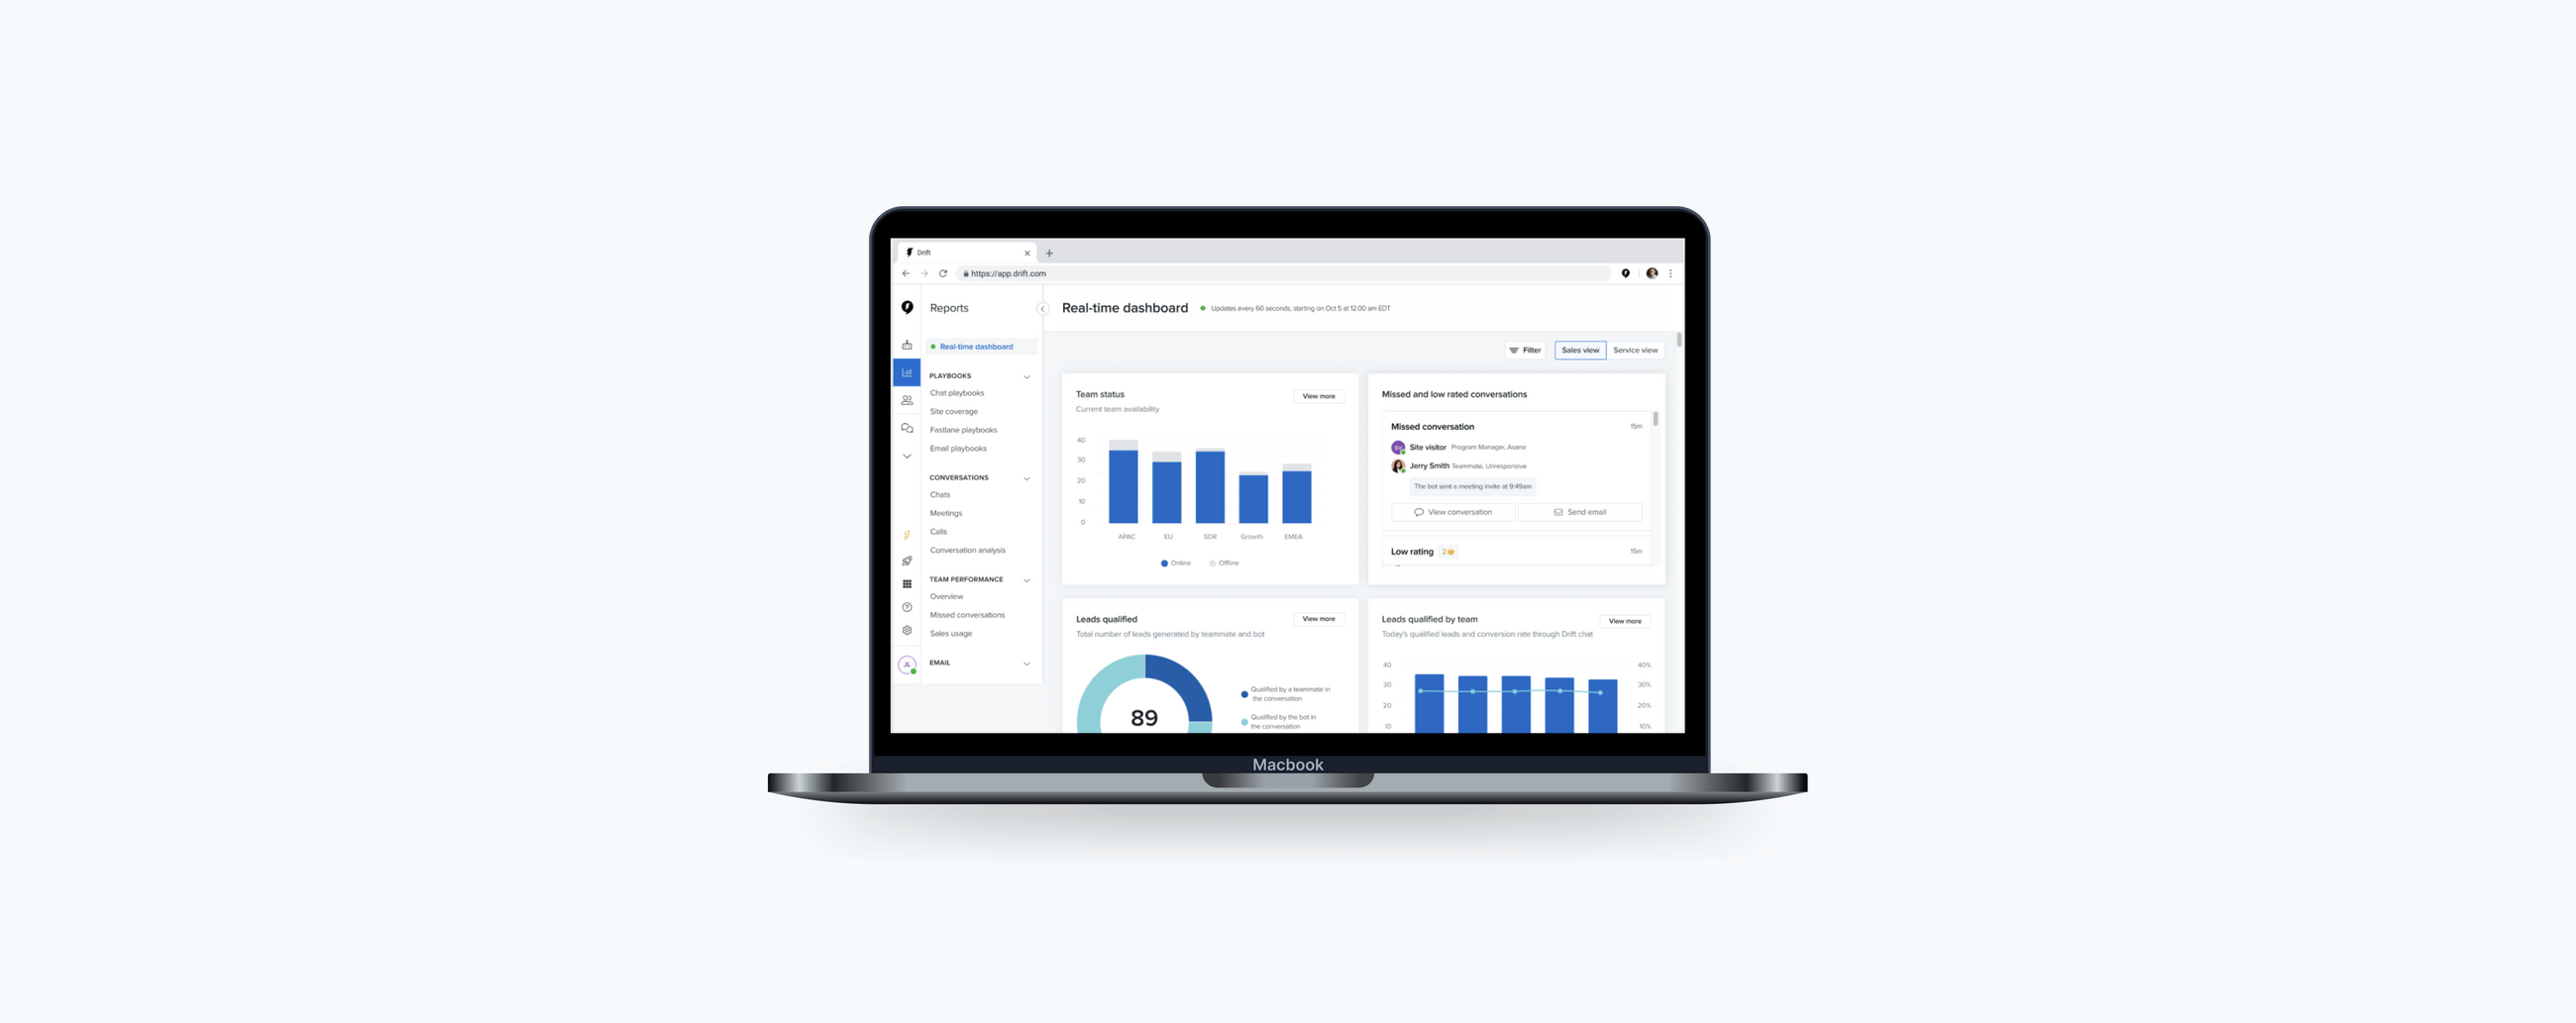
Real-time dashboard idea sparked through service premium and enterprise organizations request. Later on through customer research we expanded to sales managers.
Problem
The current historical reports do not allow sales managers to coach their reps in real time and give visibility into their teams performance.
Goals
As a sales manager my goal is to ensure my teams are generating quality qualified leads that ultimately contribute to the business’s pipeline and revenueMy goal is to coach my team so we can meet our team (and teammates) goals.
Role Model Research
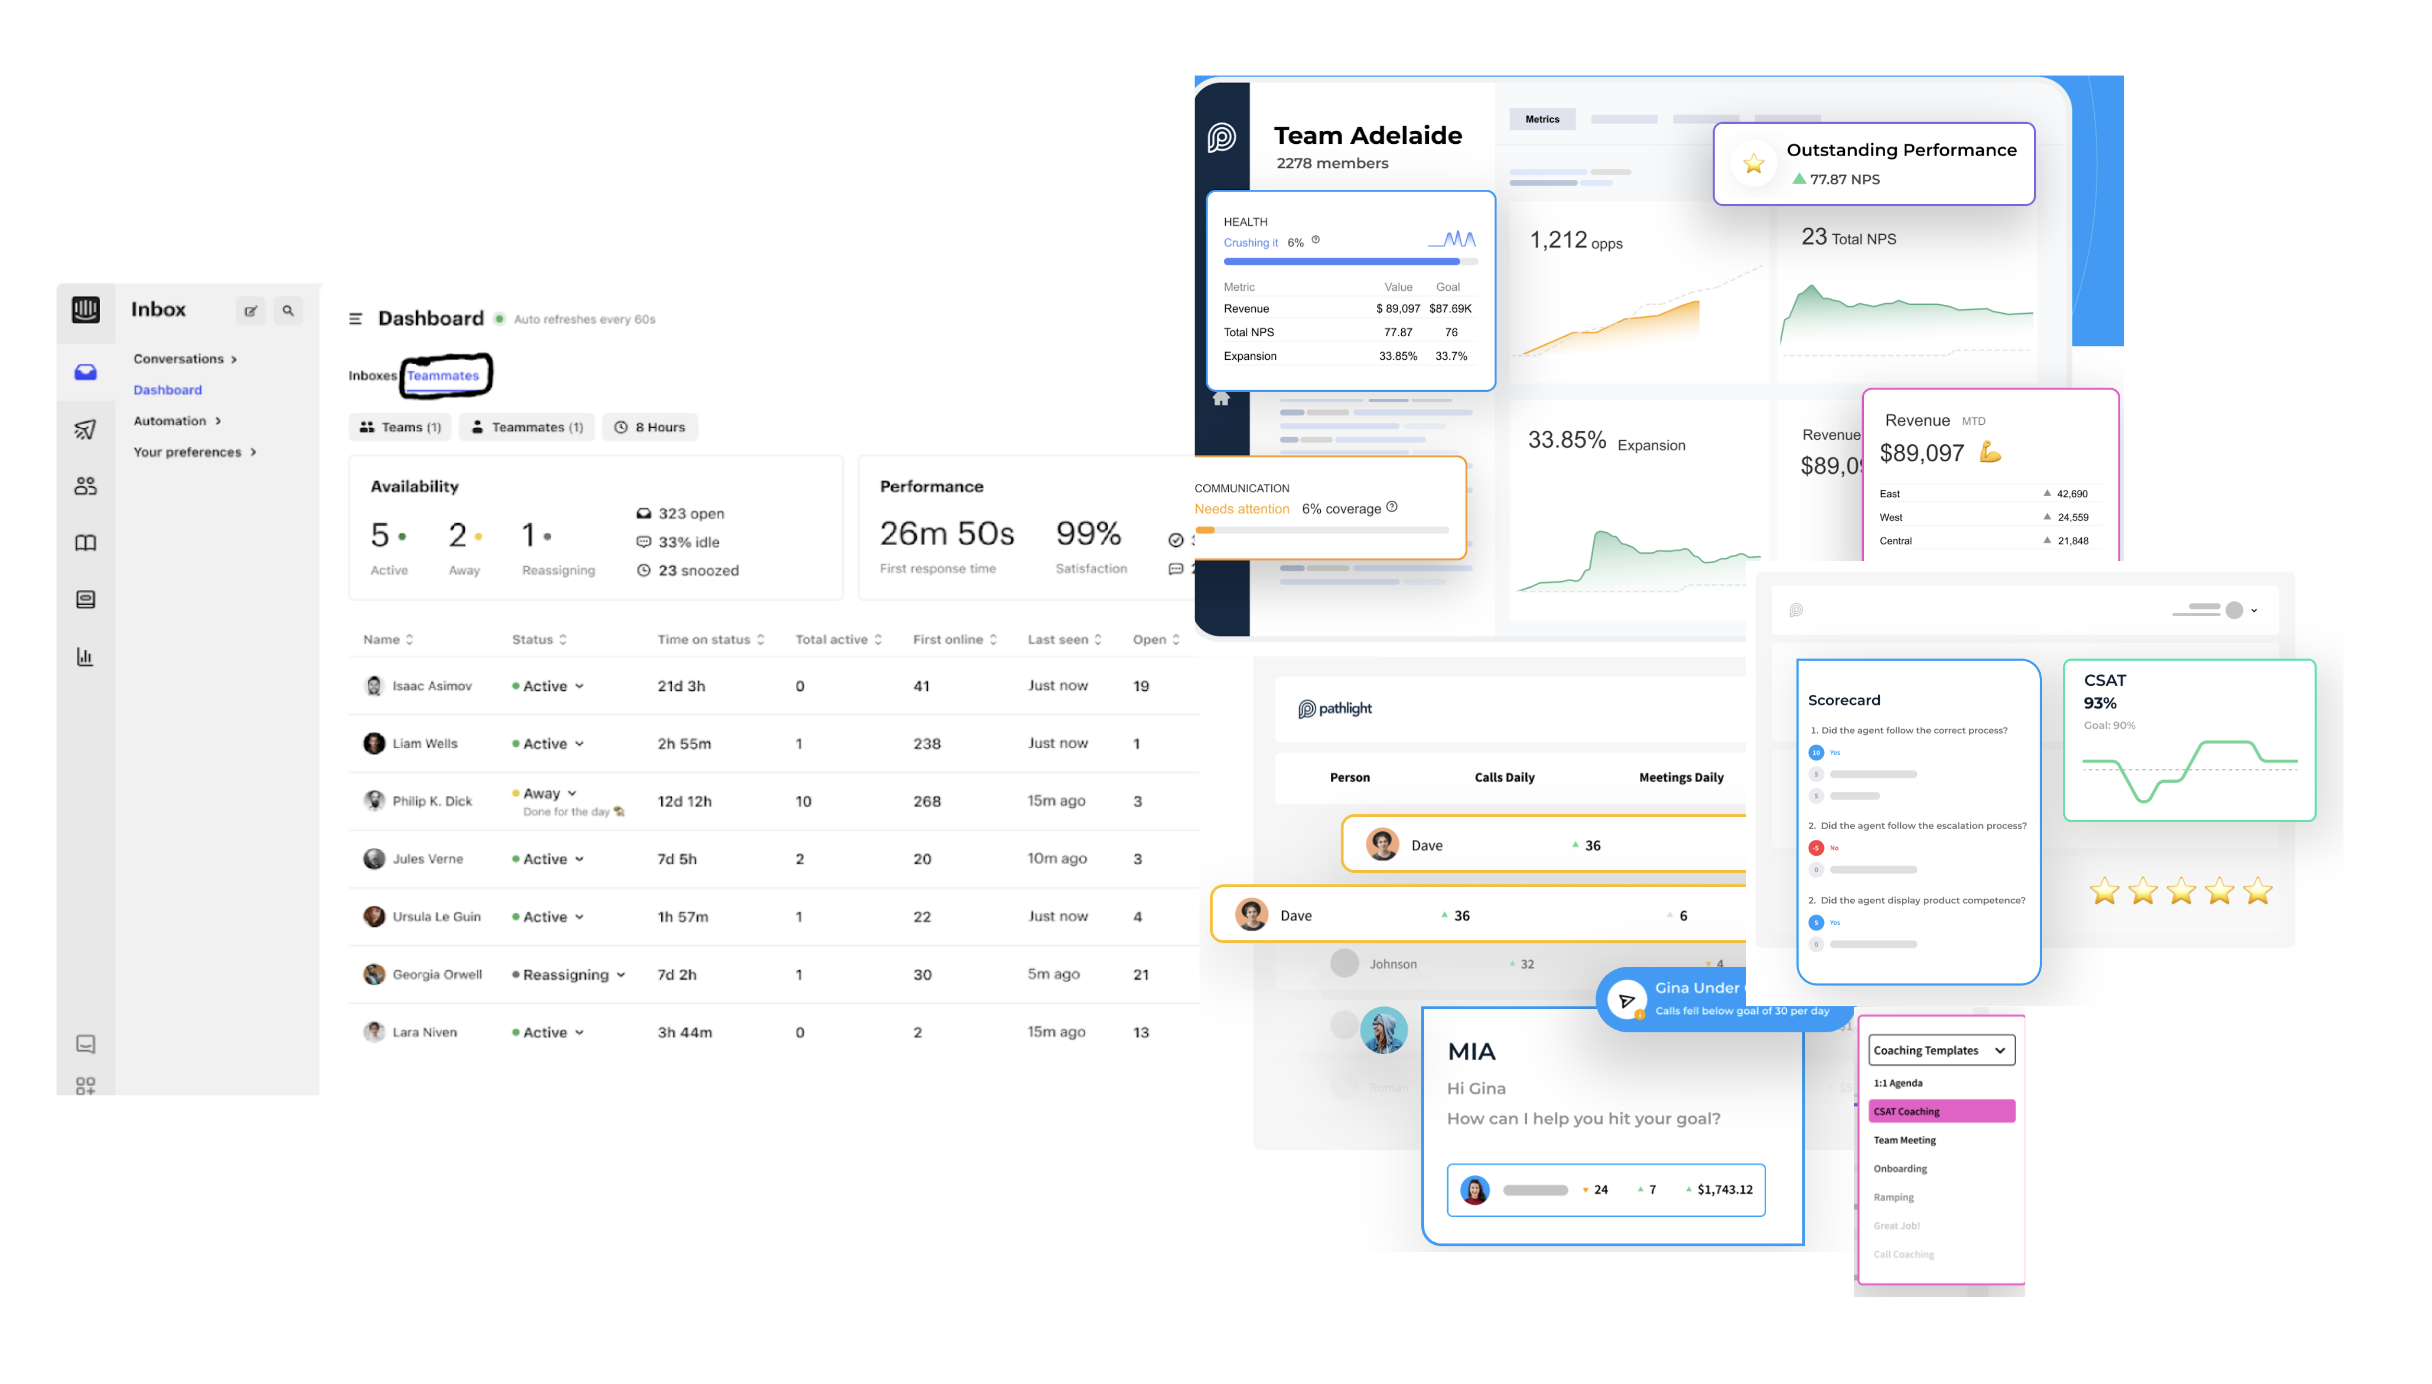
Competitive research and analysis was conducted before designing any screens. For every container and feature I try to understand what the comeptitiors offer, find key takeaways, and understand the holistic user experience.
Summary of Role Model Research Findings
- Include customization for the dashboard- Display different range of levels of visualizations- Focus on key metrics show trends, insights, data comparison in real time- Most competitors allow their customers to have the ability to export the data- Utilize automatic refresh rate to show when data is being fetched- Allow users to edit alerts, and notifications- Settings configurement are in most competitors product
Design Iterations
Numerous design iterations were involved throughout the process of the build the product from scratch. It started from a service real-time dashboard that transformed into a sales dashboard then later drill downs were added to provide more information for the sales and service managers through customer research findings.
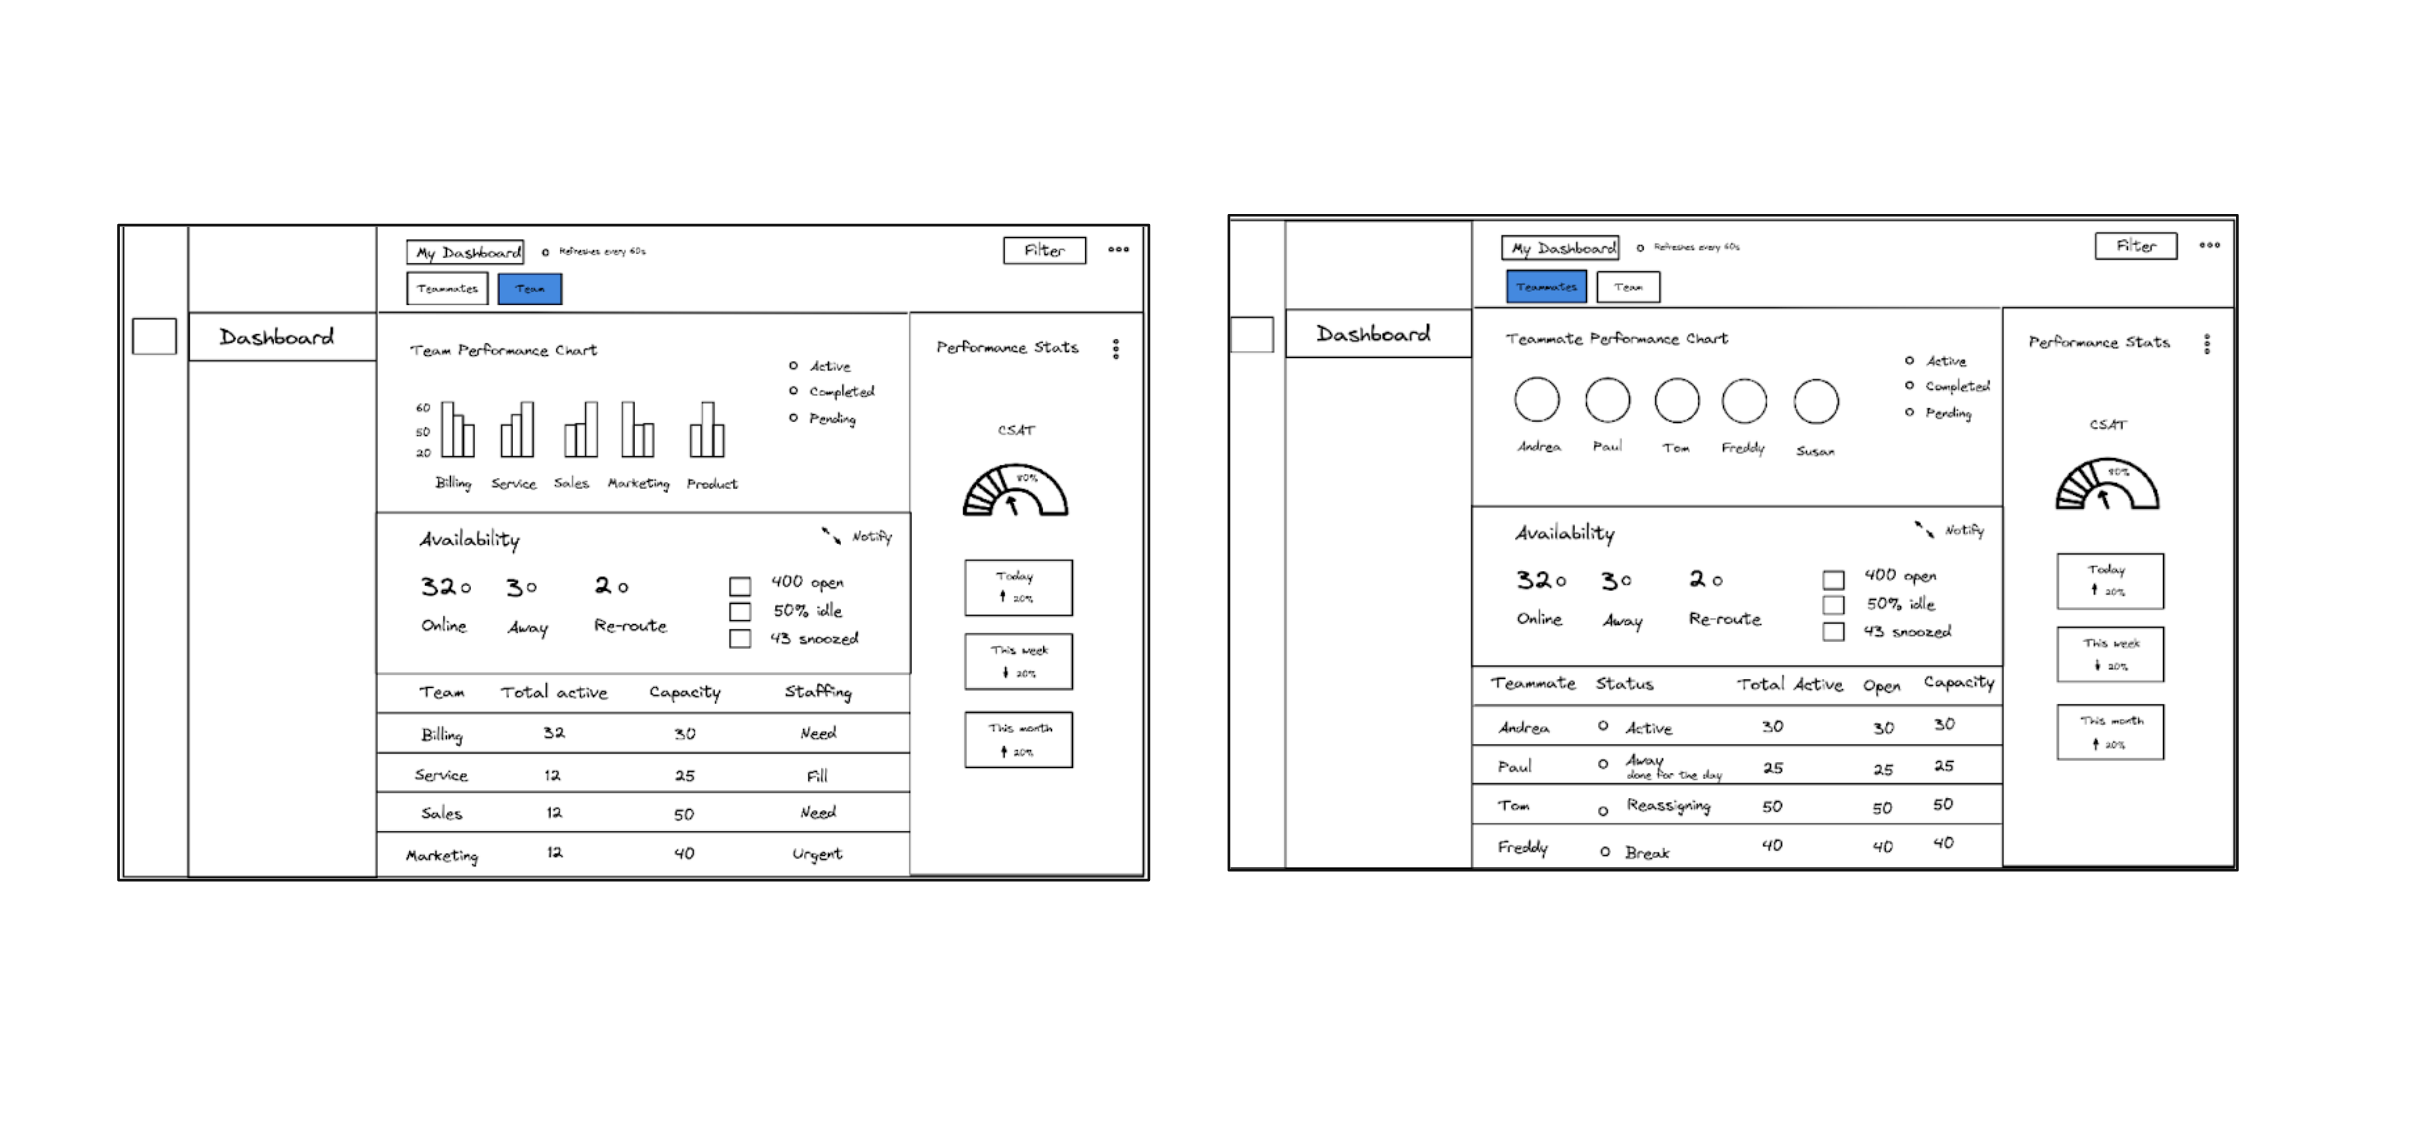
Sketches
Early sketches inspired by role models and research findings.
Design Iterations(a few of the containers)
Conversation feed design iterations started off as a place to view CSAT score but later on through research findings missed conversations were added to help sales and service managers jump into those conversation and coach their reps in real-time.
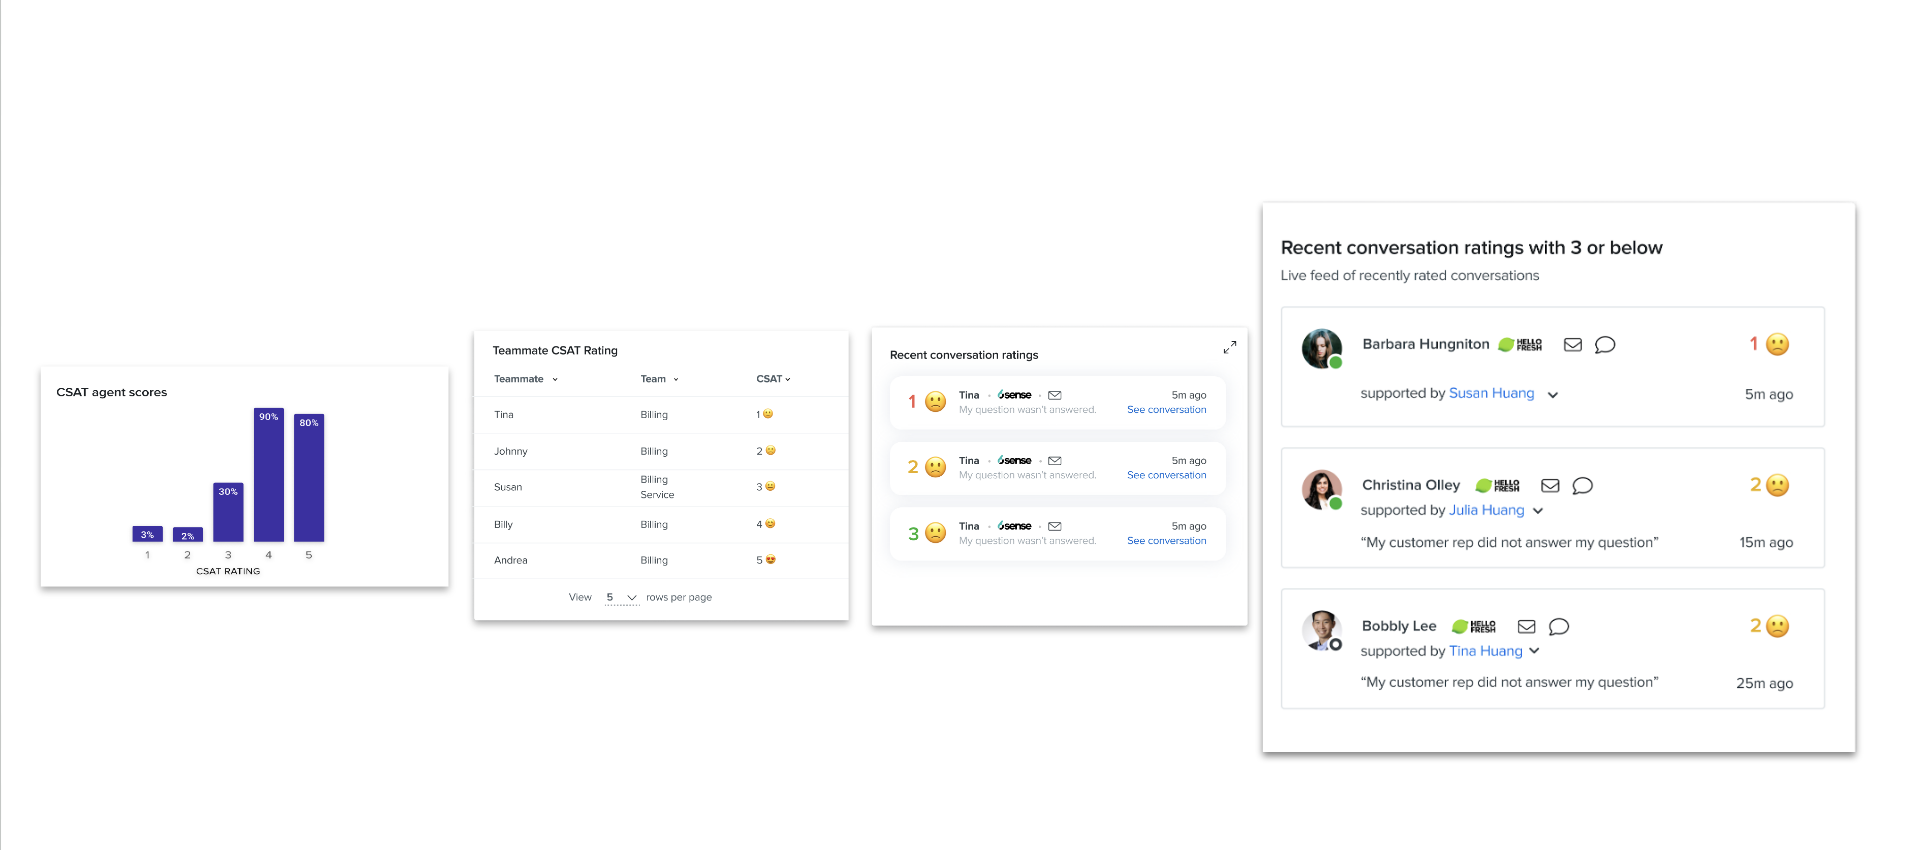
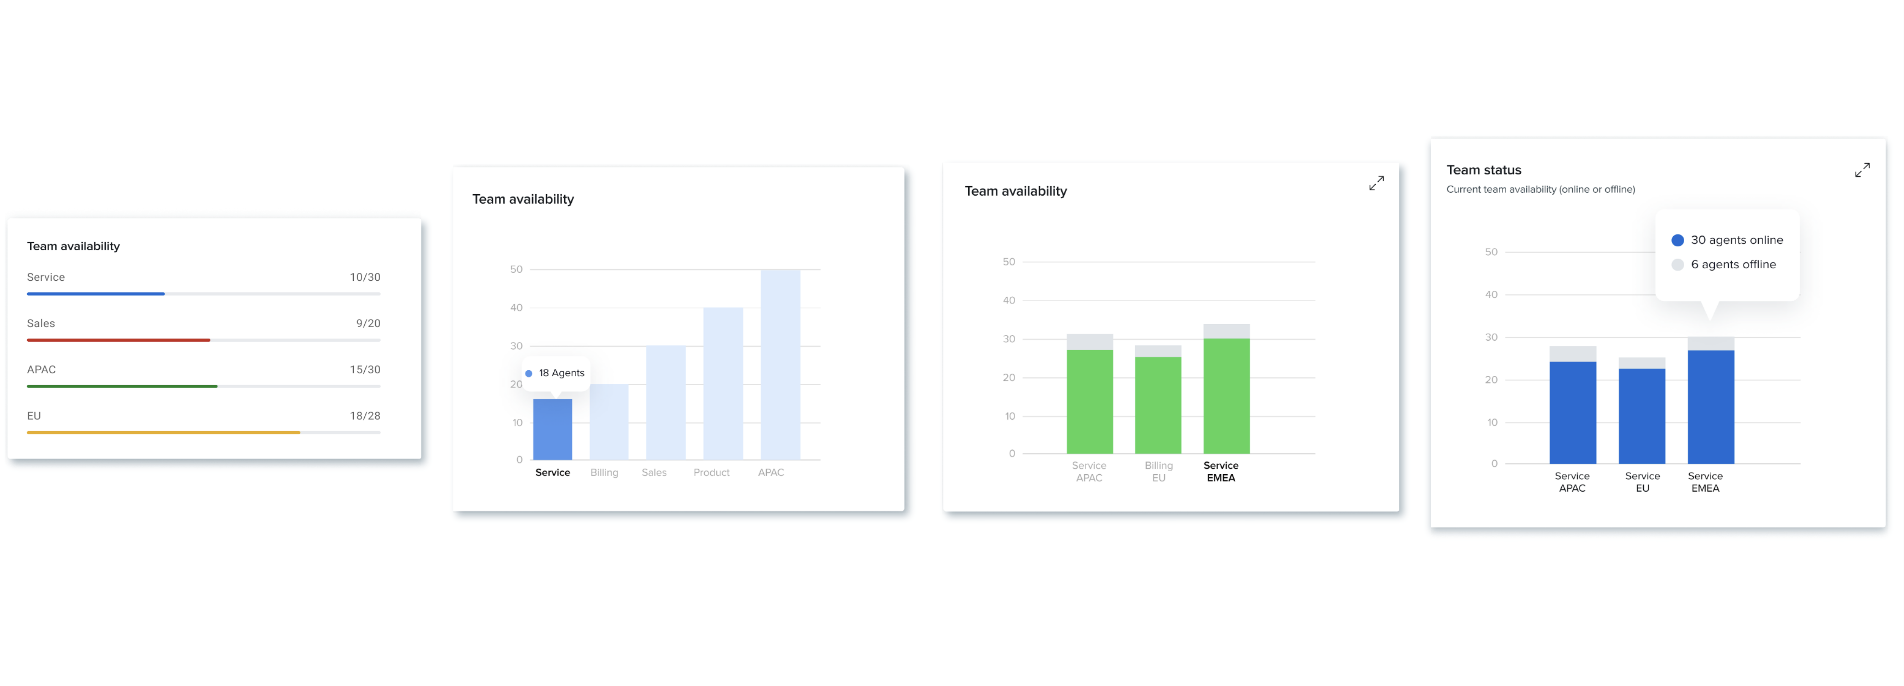
Team Status Design Iteration
Conversation feed design iterations started off as a place to view CSAT score but later on through research findings missed conversations were added to help sales and service managers jump into those conversation and coach their reps in real-time.
Early access program insights (Interviews)
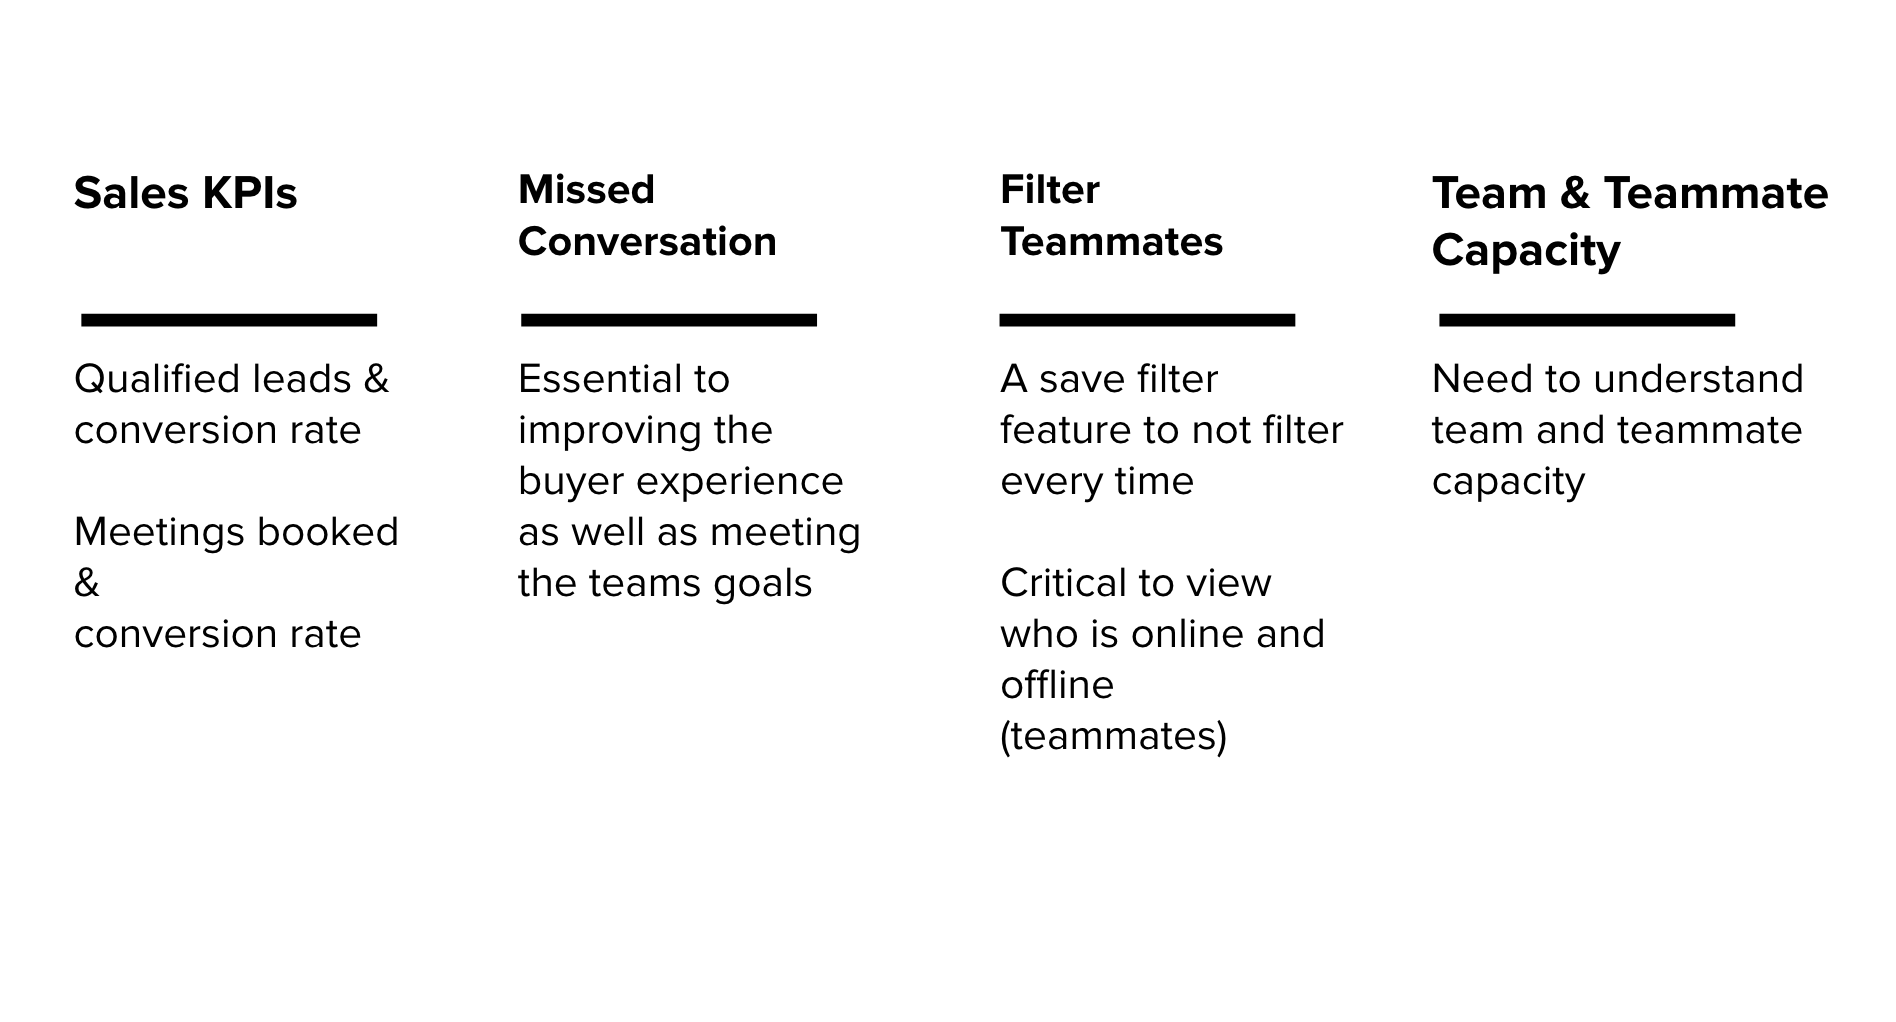
Throughout the whole research process we started off forming an early access program were super users that were interested in RTD would take time to give me feedback.Through the research sessions we found out that sales managers truly care about the sales KPIs, missed conversation metric, ability to filter teammates, and understand team/teammate capacity
Design Implementation Based on Feedback
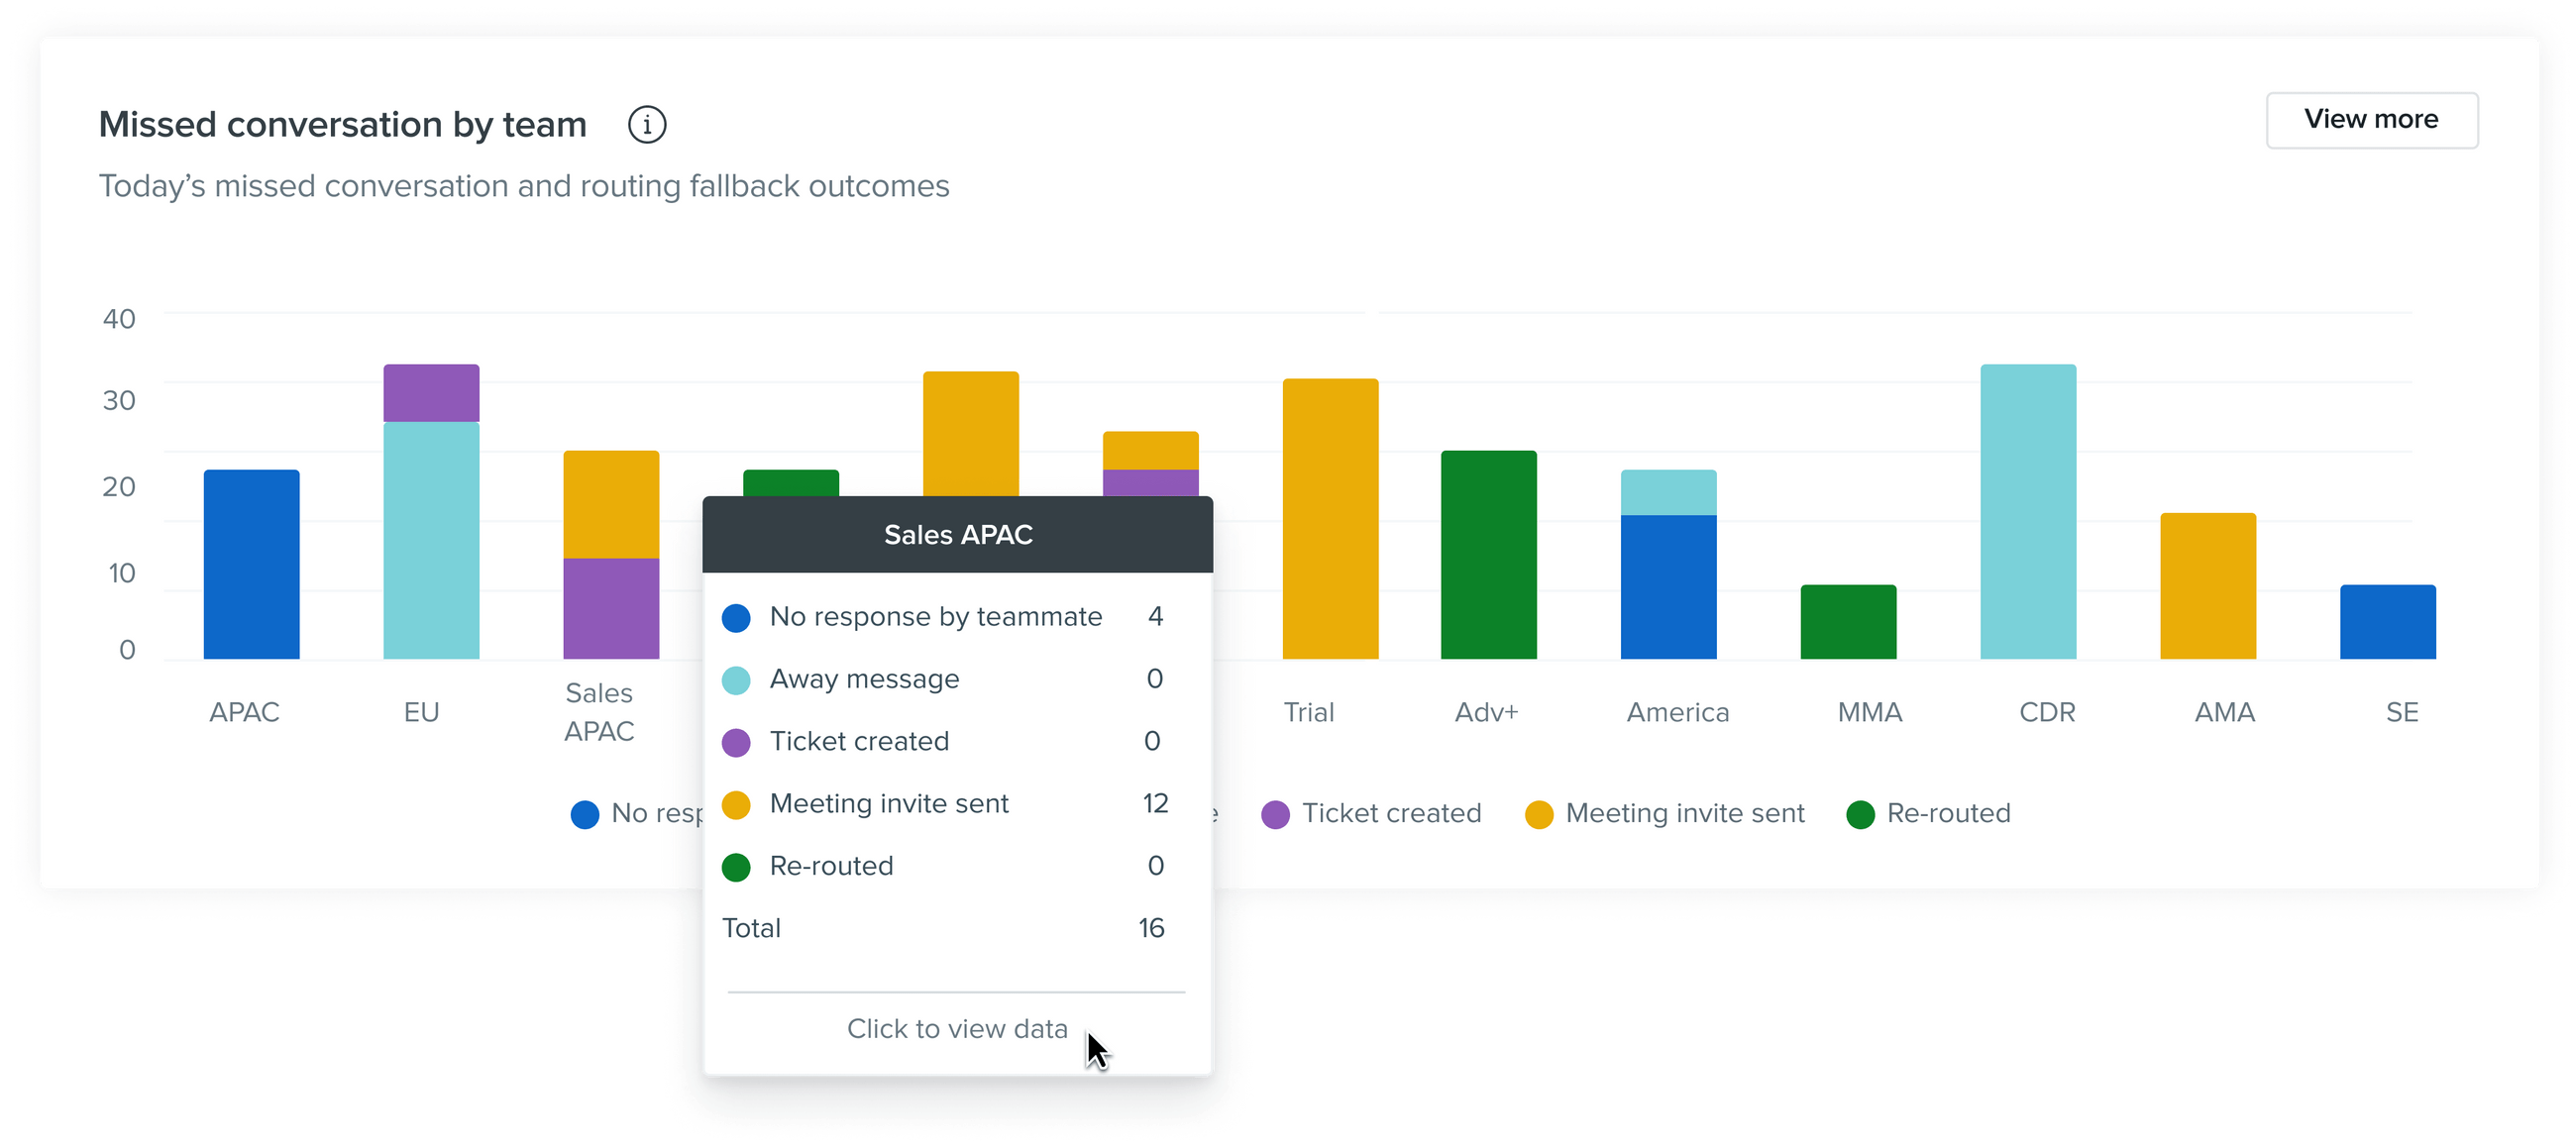
Missed conversation being added.Note: not all of the screens are displayed here
Sales managers research insights (Surveys & Interviews)
200 surveys were sent out to sales managers and marketers. About 18 sales manager interviews were conducted.Sales managers truly care about understand if their reps were hitting the chat and call goals, ability to coach and educate, understand about chat quality and quantity, and how much revenue it is generating.
Results
Daily active and monthly users60%Response timer362 orgs78% of reps reply less than 30 secondsWeekly users and orgs100 unique users91 weekly distinct orgsARR$8230,685.67
Next Steps
- Add historical data: Participants would like to see historical data from daily to monthly about the chat metrics- Automate workflows: 2 participants would like to create a lead in Drift and show up in Salesforce (SF)- Improve Live chat: Participants experience conversations dropping, missed a lot of messages,and did not get many messages from live chat.- Save filters: Participants would like to use save filters, and set filters for teams.
Takeaway
Pivot 💨Team utilization data was not turned on for only 5 customers therefore utilization metric was always blank.🔙 Backward & ⬆upwardWorking back on setting up realistic success metrics that SDR managers care about⏫ Learn and iterate fastNumerous iterations of Real-time dashboard were completed with incremental ships♾️ ResearchResearch and data is the key to understanding about the customer's needs, usage, and pain points
EndDrift - Real Time Dashboard